Charger Test Report — Power Base USB Charger (232507), lower USB-C port
Scope of this report
Engineering design verification (DVT) of the prototype's 5 V / 2 A output on the lower USB-C connector. The board has two USB-C connectors sharing one 10 W rail; the upper connector is covered in its own report. All voltages are measured at the charger terminals via 4-wire (remote-sense) wiring, so the force-lead/cable drop is removed and every result reflects the charger itself. This is not a substitute for the supplier's UL 1310 / IEC 62368-1 / FCC certification.
| Field | Value |
|---|---|
| DUT | EverTag Power Base USB charger (232507) |
| PCB revision | 10001135-V1 |
| USB-C port under test | Lower (GND prong down) |
| Sample | prototype 260609-1 |
| Test date | 2026-06-09 |
| Operator | Olov |
| AC source | 240–110 V AC adapter, 115 V / 50 Hz |
| Connection | 4-wire remote sense (all phases) |
| Load | Rigol DL3021A @ 10.0.20.216 |
| Scope (ripple) | Rigol MSO5072 @ 10.0.20.184 (CH1, AC, 20 MHz BW) |
| Overall verdict | PASS |
Acceptance criteria and the standards each limit comes from are documented once in the Charger Test overview.
1. Load regulation
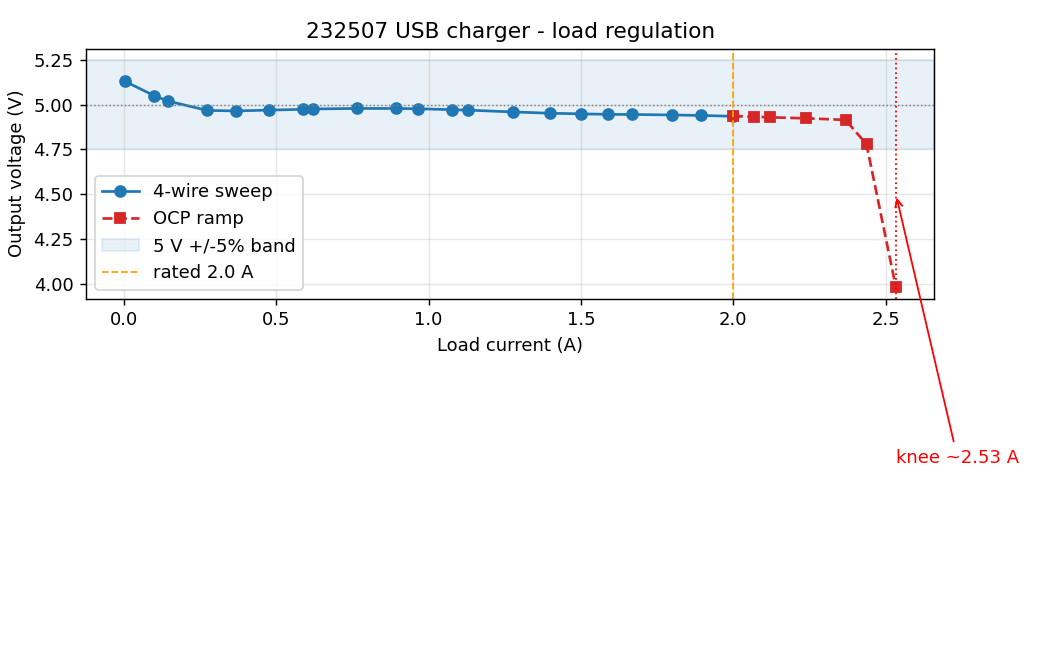
Why we test it. A USB source must hold its output inside 5 V ±5 % (4.75–5.25 V) from no load to full rated load (USB 2.0 VBUS at the connector). Sagging out of band starves the device and trips brown-out logic.
Expected. Every point from 0 → 2.0 A stays within 4.75–5.25 V.
Result — PASS. Output ran from 5.131 V at no load to 4.935 V at 2.0 A — a ~0.20 V droop, with all 21 sweep points inside the ±5 % band (worst case 4.935 V at full load, ~0.19 V of margin to the 4.75 V floor). Being a 4-wire measurement, that droop is the charger's own output impedance, not test leads.
2. Output power
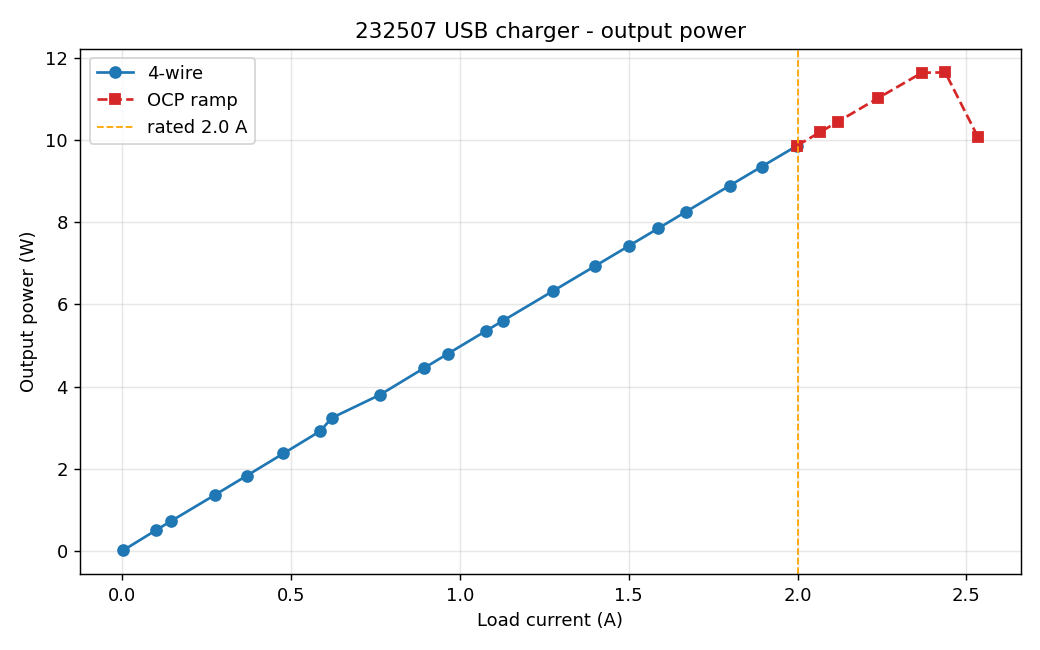
Why we test it. Confirms the charger delivers its rated 10 W without the voltage collapsing — the power curve keeps climbing to 2 A instead of rolling off early.
Expected. Power rises roughly linearly to ≈10 W at 2.0 A while voltage stays in band.
Result — PASS. Power tracked the load cleanly to ≈9.9 W at 2.0 A (4.935 V × 2.00 A), consistent with a 10 W rating measured at the terminals.
3. OCP / current-limit knee
(OCP ramp is the red dashed trace on the load-regulation graph above.)
Why we test it. Beyond the rated 2 A the charger must limit current gracefully and recoverably (UL 1310 Class 2 / IEC 62368-1 over-current protection) — not latch off and not keep pushing power into a fault.
Expected. A current-limit knee above ~2.2 A (margin over the 2.0 A rating), with a graceful, recoverable foldback.
Result — PASS. The charger held regulation up to 2.4 A (4.91 V), then folded back: at 2.5 A the output dropped to 4.78 V and by 2.6 A it collapsed to 3.98 V. The detected knee is ~2.53 A — a healthy ~0.53 A margin over the 2.0 A rating — and the behavior is voltage foldback / hiccup, the graceful, recoverable mode we want.
4. Short-circuit + recovery
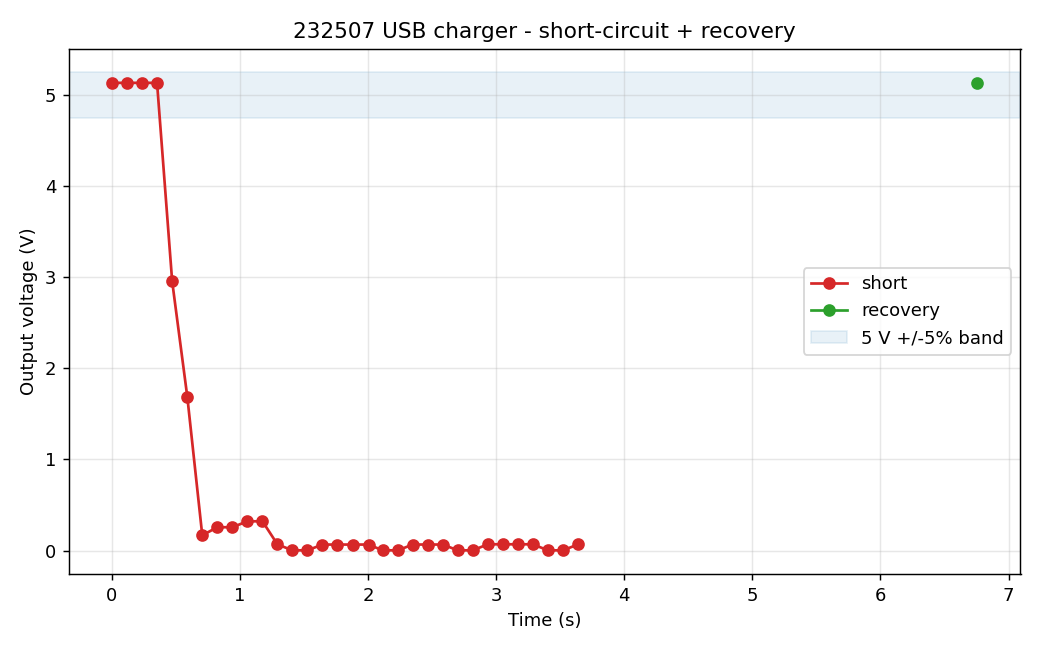
Why we test it. A dead short across the output must trip protection and the charger must recover to 5 V once the short is cleared (UL 1310 / 62368-1 short-circuit protection) — no latch-off, no damage.
Expected. Output collapses toward 0 V under the short, then returns to ~5 V after the short is removed.
Result — PASS. Under the applied short the output collapsed from ~5.1 V to ≈0 V and entered a hiccup retry pattern (periodic ~0.13 A restart pulses while the fault was present). After the short was cleared the output recovered to 5.137 V. Correct trip-and-recover behavior.
5. Soak (300 s @ 2 A)
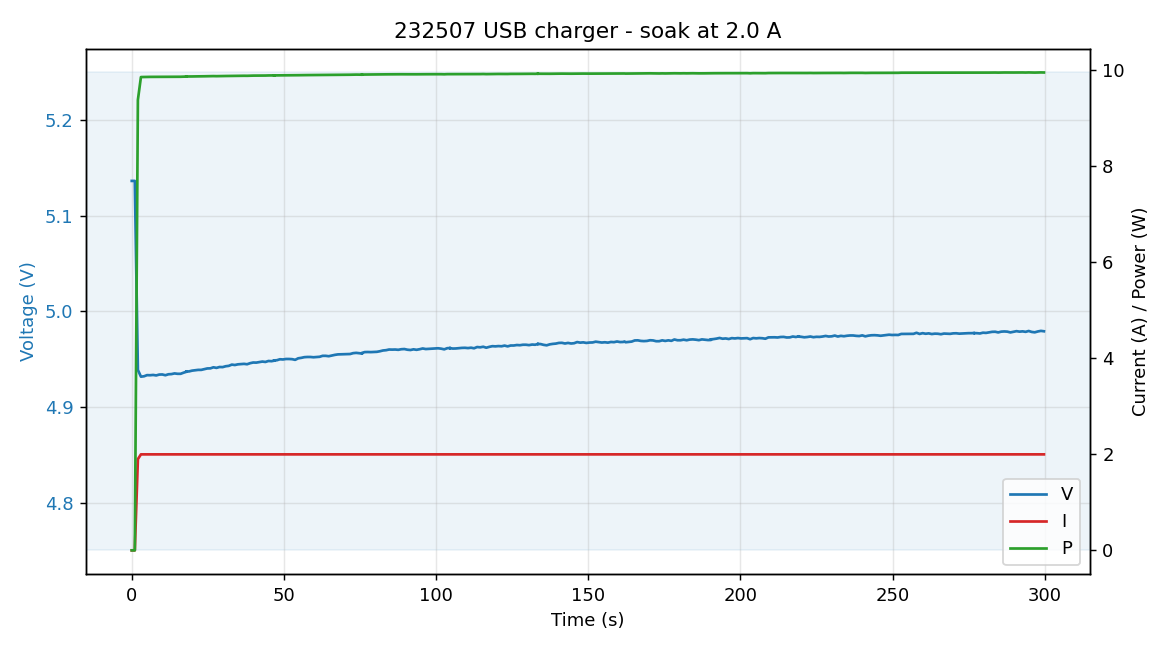
Why we test it. Sustained full-load operation surfaces thermal problems — voltage droop as parts heat, or a thermal-foldback/over-temperature trip (IEC 62368-1 temperature-rise / derating).
Expected. Vout stays in band for the full 300 s with no trip and no downward thermal drift.
Result — PASS. The charger held 2.0 A for the full 300 s with no trip. Output stayed between 4.93 V and 4.98 V under load (it drifted slightly up, not down, over the soak — no sign of thermal foldback), comfortably above the 4.75 V floor.
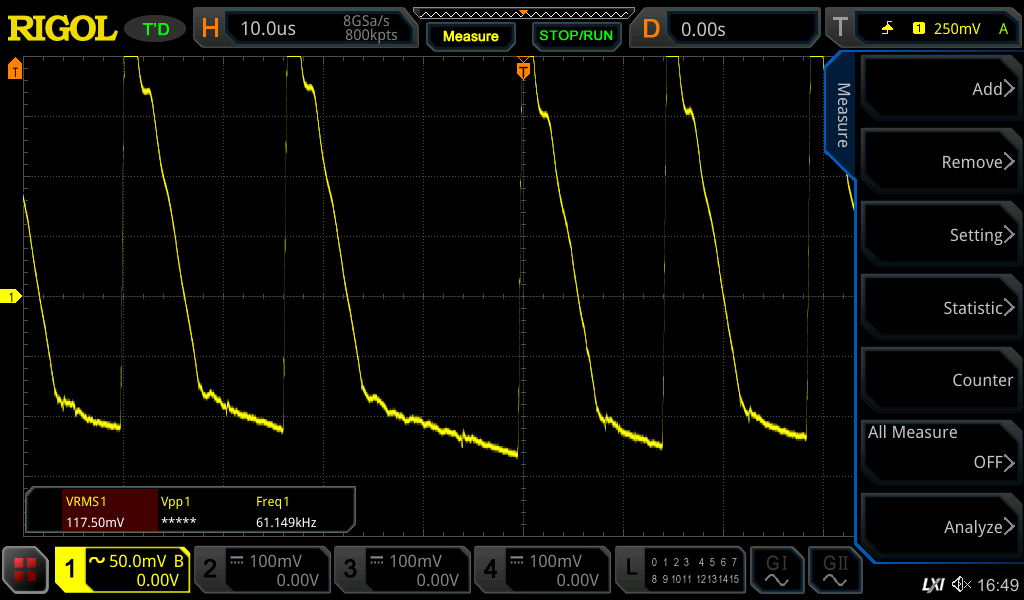
6. Output ripple
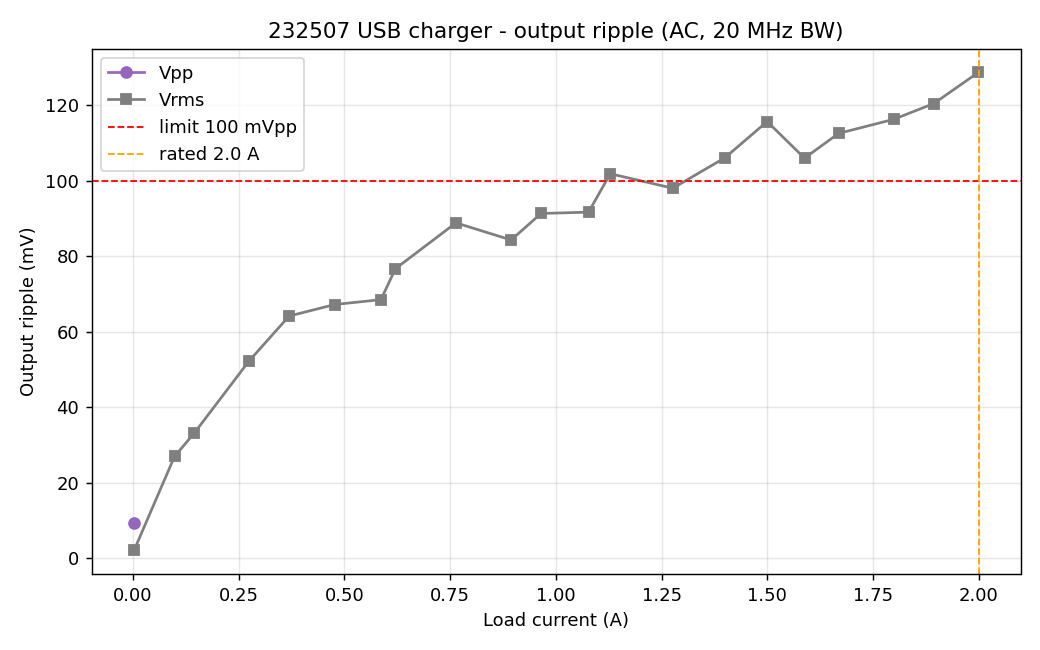
Why we test it. Excessive output ripple/noise can disturb the powered device. There is no hard USB source ripple limit, so we apply an engineering target of ≤ 100 mVpp (AC-coupled, 20 MHz bandwidth-limited).
Expected. Peak-to-peak ripple stays under the 100 mVpp engineering limit.
Result — PASS. Worst-case measured ripple was 9.4 mVpp, an order of magnitude under the 100 mVpp target. The full-load scope capture below is the authoritative worst-case measurement.
Summary
| # | Test | Expected | Result | Verdict |
|---|---|---|---|---|
| 1 | Load regulation | 4.75–5.25 V, 0→2 A | 5.131→4.935 V, all points in band | PASS |
| 2 | Output power | ≈10 W at 2 A | ≈9.9 W at 2.0 A | PASS |
| 3 | OCP / current limit | knee > 2.2 A, recoverable | knee ~2.53 A, graceful foldback | PASS |
| 4 | Short-circuit | trips then recovers to 5 V | collapsed to ~0 V, recovered to 5.137 V | PASS |
| 5 | Soak 300 s @ 2 A | stable, no trip | 4.93–4.98 V, completed, no trip | PASS |
| 6 | Output ripple | ≤ 100 mVpp | 9.4 mVpp worst case | PASS |
Overall: PASS. The lower USB-C port meets every bench acceptance criterion for a 5 V / 2 A isolated USB-C charger, measured at the terminals with 4-wire remote sense, and behaves consistently with the upper port. OCP, short-circuit and temperature limits are formally certified by the supplier's UL 1310 / IEC 62368-1 evaluation; this report is an early engineering check, not the certification.
Generated from power_base_charger_test.py run run_proto-bottom_20260609_103003
(2026-06-09). Raw data (sweep_4wire.csv, ocp_ramp.csv, short.csv, soak.csv)
and the source protocol.md are retained with the harness.